![]()
Opta Consulting
|
|
|
|
|
|
|
|
Opta Consulting |
||||||
|
|
|
|
|
|
|
|
|
OptAB User Interface
This page shows examples of the user interface provided by OptAB. Additional forms are used by the developer as he configures the application.
The Application Window
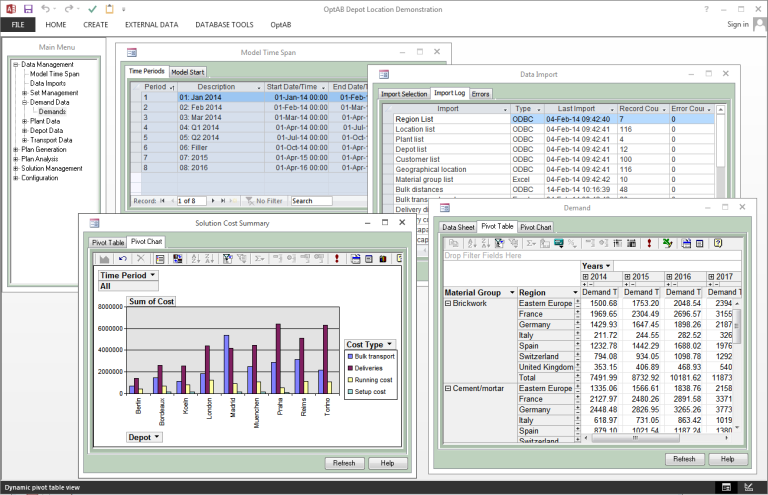
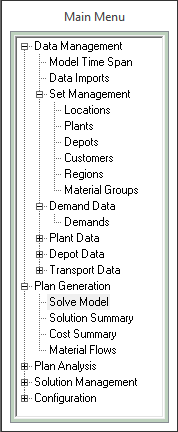
The application is a standard Access window in which multiple child windows may be opened. All principal user functions are accessed from the main menu window in the top left. The application shown here is a multi-time-period depot location model.
The Main Menu
|
||||||
|
|
The Windows Explorer-style menu can organise a large collection of data and functionality into an easily-navigated structure. The contents and structure are fully customisable by the developer.
In this case the menu is set up to follow a common workflow - define the model time span, import data that has changed, review that data, solve the resulting planning problem, review the solution and finally export the results. |
|||||
|
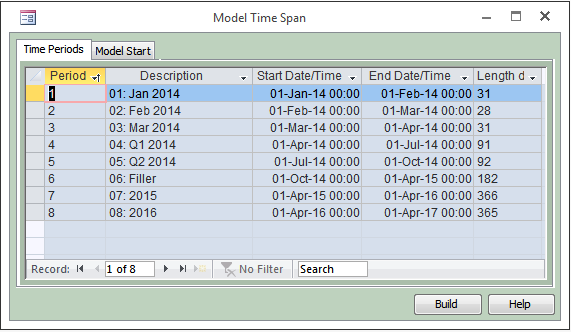
Model Time Span
Time periods are automatically generated from the definition created by the developer, which may include groups of periods of different types as here. The user simply chooses a new start date (and time) from the calendar control on the Model Start sheet and clicks Build to rebuild the time period set and refresh all related data structures.
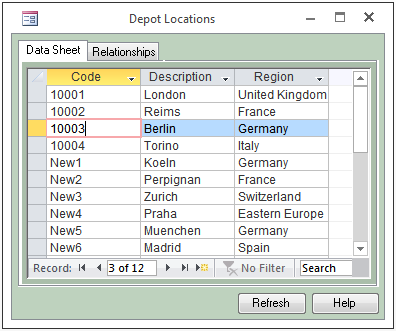
Set Viewing and Editing
|
||||||
|
The data model in OptAB is founded on the unifying concepts of sets which are lists of items, and tables, which hold data dimensioned by one or more of those sets. In this sample application, the Depot set lists existing and potential depot sites. Each location is associated with a region (taken from the Region set), which may be used for aggregation in data and reports.
The set view may be configured to allow edits to individual fields. Consistency is enforced by database relationships. Clicking in a cell in the region column will show a drop-down list for selection. |
|
|||||
|
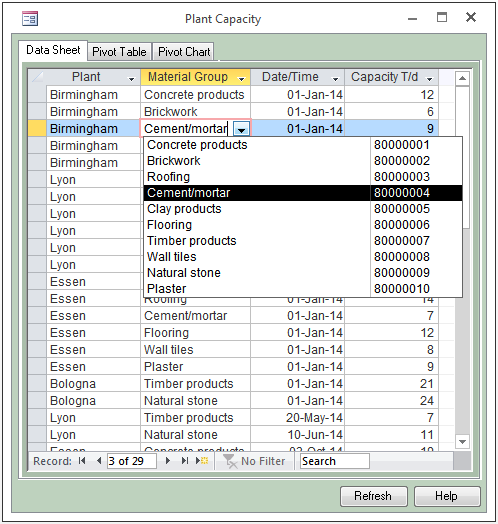
Table Viewing and Editing
|
This table has two standard dimensions – Plant and Material Group. A drop-down list is shown with possible entries in each dimension field. The data also varies over time, so each record has an effective date. Conversion into time periods is handled automatically. This table holds one numeric data value. Data may also be free-form text, a selection from a list, a date/time value, an RGB colour value or a member of another data set. Multiple values of different types may be held in one table.
|
|||||
|
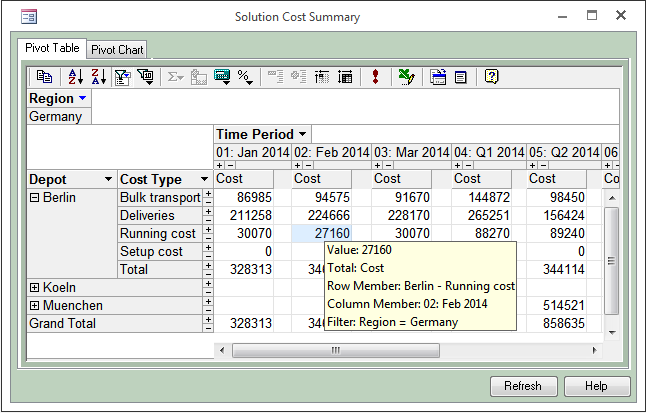
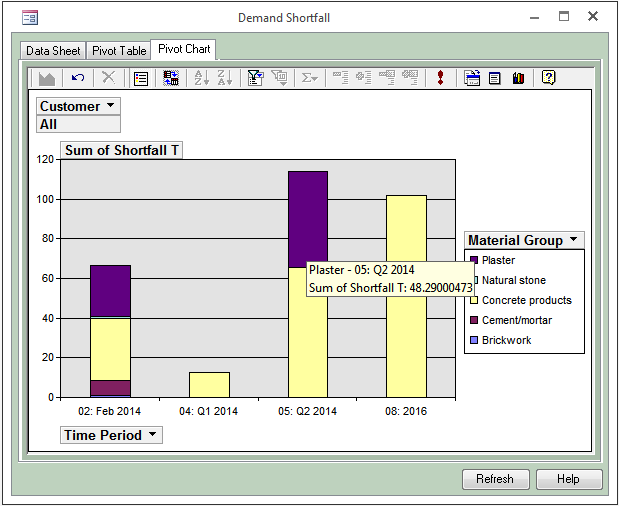
Pivot Tables and Charts
Tables can also be configured to display as a Pivot Table or Pivot Chart. The selection and arrangement of filters, rows, columns and data entries and formatting is dynamic under user control and parts of the table can be collapsed or expanded. The user's formatting choices are saved for next time.
Pivot chart options include graph type, choice of filters, categories, series and data values, all under user control. All selections are saved.
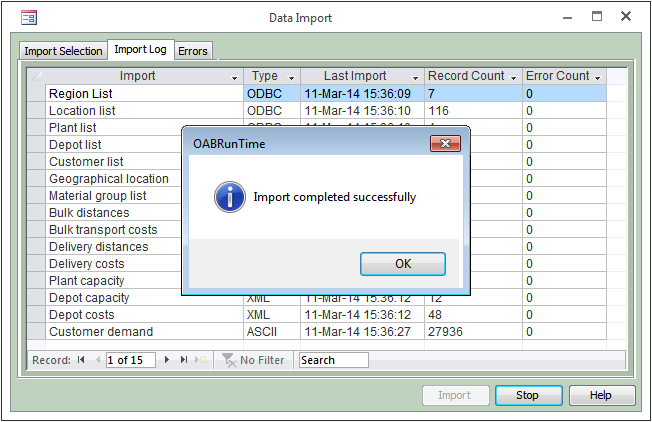
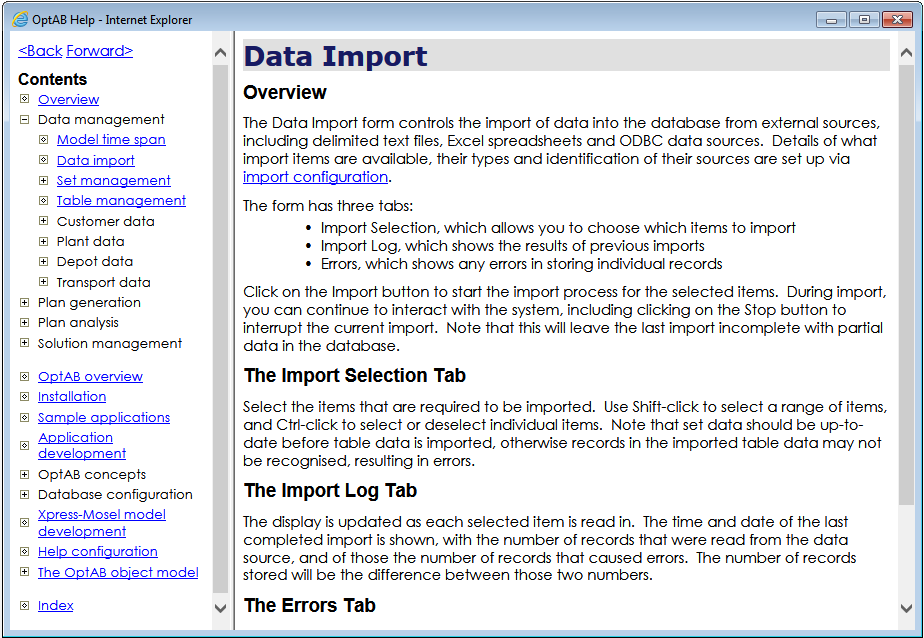
Data Import
The Data Import form allows the user to select data to be imported and displays a regularly updated log as data is read in. Each record is checked for validity, consistency with other data and duplicate records as it is read, and errors are reported in detail.
A similar form is available for data and solution export.
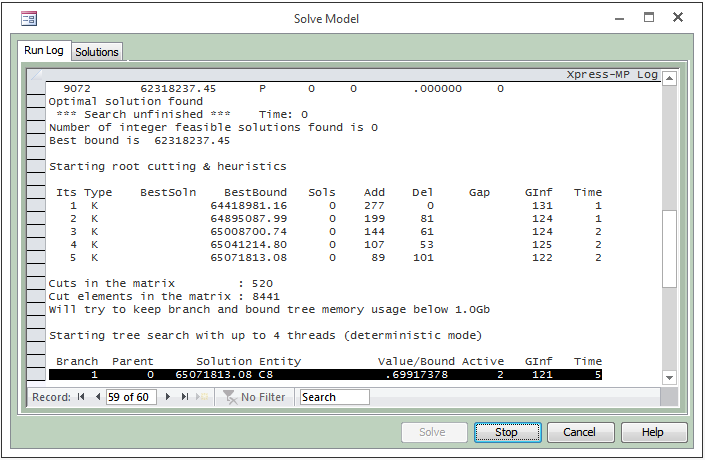
Model Solution
The Solve Model form displays a running log of solution progress, returning all messages from Xpress-Mosel and Xpress-Optimizer. During solve the user can continue to interact with the system. The user can stop a long run, returning the best solution found so far, or cancel to abort the solution process.
|
||||||
|
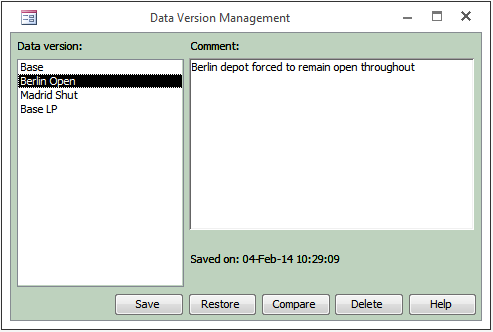
Data Version Management
A complete collection of input data and a corresponding plan can be saved by the user as a data version, with a free-form comment. The data version can be restored later or compared with other data versions, at a summary level or in full detail.
|
|
|||||
|
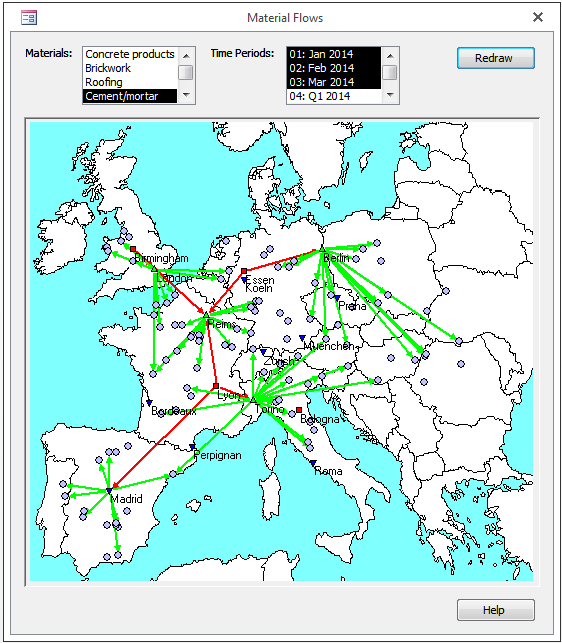
Custom Forms
|
New custom forms may be developed for your application. With the support of the OptAB objects model, interactive data-driven graphics can be added to the form. This custom form shows flows of material in the network in the current solution, filtered by the user's selections.
|
|||||
|
Help
Comprehensive (customisable) help is available from every form.
|
||||||
|
© Opta Consulting Ltd 2005-19 All Rights Reserved. This website does not use cookies. |