![]()
Opta Consulting
|
|
|
|
|
|
|
|
|
|
|
|
|
|
|
|
|
|
|
|
|
|
|
|
|
|
|
||||||||||||||
|
|
|||||||||||||||||
|
A petrochemicals manufacturer, engaged in a company-wide initiative to bring its supply chain management systems and processes into line with best practice. The company ERP system had been recently extended to include the detailed manufacturing and distribution data needed for supply chain planning.
|
|||||||||||||||||
|
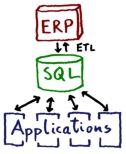
Data is passed from the ERP system into an intermediate SQL database via an ETL (extract, transform, load) layer nightly. The planning applications communicate exclusively with this database, downloading data and uploading validated plans on demand. The applications include demand management with collaborative forecasting, supply planning, detailed scheduling, and available-to-promise.
|
|
||||||||||||||||
|
Implementation of the ETL layer and the applications proceeded in parallel with independent teams. When data became available in the SQL database and was first loaded into the planning modules, it became apparent that large parts of it were inadequate. Some tables were unpopulated while others were filled with automatically generated junk. Some required structures were simply missing.
|
|||||||||||||||||
|
|
The business had the correct version of this data available in various forms, mainly on paper and in spreadsheets. There was no unifying structure to the spreadsheets, and even the same type of data (for example transport costs) was held in different layouts by different product areas within the business. There was no resource available for retyping this data into the ERP – staff were busy keeping up with new data entry requirements.
|
||||||||||||||||
|
Projects can often fail as a result of missing data. During development, modelling assumptions cannot be validated, and the opportunity for new insights is lost. During acceptance, end users cannot relate sample output to their business situation. And of course if the lack of data continues, the system will be unable to produce useful output when (or if) it enters production.
|
|||||||||||||||||
|
We decided (with mutual agreement) to exceed our contracted scope to tackle the problem head on. Developing interfaces into the ERP appeared to require a great deal of input from the limited expertise remaining with the customer. The only way forward was to make the SQL database the "system of record" for much of the data, and provide a cheap and simple interface mechanism to access it. The staff are used to working with spreadsheets so it was natural to build a new interface tool in Microsoft Excel using Visual Basic for Applications.
|
|||||||||||||||||
|
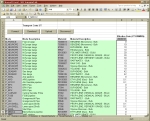
The interface had to be configurable by trained staff within the business, not only by the developers or IT support staff. In each spreadsheet file, one special sheet (normally hidden from the end user) contains configuration options – normally not more than a dozen lines for each database table. Each defined view of a table is shown in a worksheet on its own, with buttons to connect to the database, download data, upload modifications, and disconnect.
|
|
||||||||||||||||
|
Configuration options include:
The tool took three man-weeks of development up to the point where it could be installed and used by the customer, but saved months of time for the whole project. Subsequent extensions and interface enhancements (including colour-coded cells) ensured that the system would continue to be useful beyond the end of the project. |
|||||||||||||||||

© Opta Consulting Ltd 2005-19 All Rights Reserved. This website does not use cookies.